Putney Agents Hope for Better After 'Worst Ever' Year
Prices and turnover continue to slump although high ticket sales continue
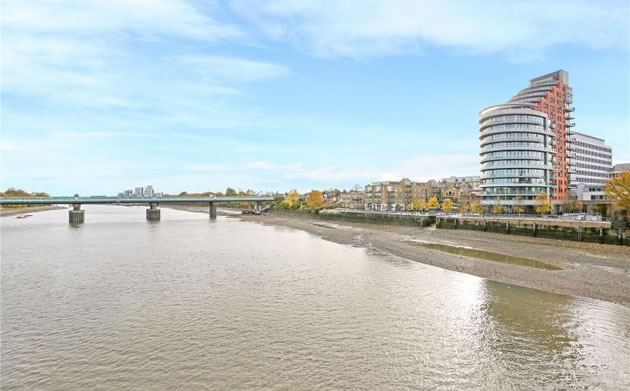
A flat in the Putney Wharf Tower sold for over £2,000,000
The market for property in SW15 saw one of the lowest levels of turnover on record as hopes for an autumn recovery failed to materialise and local agents expect tough market conditions to continue.
Home prices fell in Putney and Roehampton by 4% in 2017 and the drop would have sharper but for a number of high-priced sales at the top end of the market. A house on Priory Lane changed hands for £3,290,000 and a flat in the Putney Wharf Tower cost its new owners £2,450,000. This is the third highest price ever paid for a flat in Putney, the top price being for the penthouse in the development which sold for £3,400,000 in 2014.
Volumes remained anaemic with just 112 sales being reported so far to the Land Registry for the SW15 post code area. This means that local agents are being forced to cope with less than one sale a day going through to share between them.
One local agent who preferred not to be named told PutneySW15.com, “These are the worst market conditions I have seen in over 20 years. The amount of stock for sale is way below anything I have experienced and cost pressures continue to mount with rent and rates rising. Luckily the rental side continues to provide a steady income but any new entrants dependent on sales are in serious trouble. On the one hand 2018 has to be better but the suggestion by the Bank of England that interest rates are going to rise faster and higher than expected might make that wishful thinking.”
Local agent Allan Fuller commented, " Property prices locally have drifted and softened during 2017. As I have mentioned before there are two causes. One is the changes to stamp duty which has hit prices over £935k, and made a second property purchase more expensive with a 3% tax hike. The other is overpowering gloom in all of the media and the constant barrage of dire forecasts of the consequences of leaving the EU.
"With these two factors at play it is understandable that people are sitting tight and not moving yet. This will change, most people move out of necessity, and can only put it off for so long. So pent up demand will be released when there is clarity.
"Meantime in my office we are constantly proving that sales are happening when an asking price is sensible. In fact we are delighted with the amount of sales we have agreed so far this year."
The average price of a home in SW15 is now just over £700,000. Prices for flats do appear to have performed better over the year but the average has been artificially boosted by the Putney Wharf sale. Without that the level of decline in 2017 for both flats and terraced houses is around 10%
The rental market in SW15 remains quite firm. Allen Fuller says, "the lettings side of the business has been amazingly busy, in fact over the last 4 months they have agreed 50% more new lettings that the same period a year ago. This is because people coming to London to work are renting and not buying. Secondly since we opened 35 years ago the average age of first time buyers has gone from mid-twenties to mid to late 30s.
"People still want their own homes, but flexibility of where to live, and to be able to very easily move as jobs change is more appealing than regular buying and selling. Interestingly the same trend is obvious in the changes in average ago that people start to have children. It’s not so much just about property, more about a large change in lifestyle."

According to the Nationwide House Price Index, property values in London as a whole fell for the first time in eight years during 2017 down by half a percent. This made it the weakest performing region of the country for the first time since 2004.
Across the UK the price of the average home rose by 2.6% to £211,156 with low mortgage rates and healthy employment growth supporting price. However, prices were held back by mounting pressure on household incomes and declining consumer confidence. Demand from buy to let investors was also held back by stamp duty and tax changes during the year.
The RICS, the professional body for surveyors, is predicting a further though slight reduction in sales this year and further price declines in the London area. They are not expecting these to be significant because of the lack of supply.
RICS UK Market Survey has recently shown buyer enquires stalling, sales volumes stagnating and sentiment turning altogether more cautious as a result in the final quarter of the year. They say stock on estate agents books close to all-time lows.
Tarrant Parsons, RICS Economist, commented, “Following a pretty lacklustre finish to 2017, the indications are that momentum across the housing market will be lacking as 2018 gets underway. With several of the forces currently weighing on activity set to persist over the near term, it’s difficult to envisage a material step-up in impetus during the next twelve months. However, the fundamentals are not much changed from the end of 2017, so levels of activity should soften only marginally when compared to the year just ending. A real lack of stock coming onto the market remains one of the biggest challenges, while affordability constraints are increasingly curbing demand in some parts. Given these dynamics, price growth may fade to produce a virtually flat outturn for 2018.”
“That said, despite the recent interest rate hike, mortgage rates are set to remain very favourable, with the prospect of further rises seemingly minimal over the coming year. Alongside this, government schemes such as help to buy should continue to provide some support to sales activity.”
| Putney Property Prices (October to December 2017) | ||||||||||
|---|---|---|---|---|---|---|---|---|---|---|
Area |
Detached |
Sales |
Semi-detached |
Sales |
Terrace |
Sales |
Flat/ mais |
Sales |
Overall Ave |
Overall Sales |
| SW15 1 | 0 | 0 | 900000 | 1 | 1221071 | 7 | 671250 | 6 | 962500 | 14 |
| SW15 2 | 0 | 0 | 1400000 | 1 | 1110000 | 2 | 649947 | 19 | 725864 | 22 |
| SW15 3 | 1498333 | 3 | 908333 | 3 | 565500 | 3 | 467336 | 19 | 635567 | 28 |
| SW15 4 | 0 | 0 | 0 | 0 | 507500 | 1 | 320800 | 7 | 344137 | 8 |
| SW15 5 | 3290000 | 1 | 1755000 | 2 | 676167 | 6 | 454000 | 8 | 852294 | 17 |
| SW15 6 | 2245000 | 1 | 0 | 0 | 712000 | 1 | 545048 | 21 | 626217 | 23 |
| Total | 2006000 | 5 | 1219286 | 7 | 887025 | 20 | 532244 | 80 | 704330 | 112 |
| Last quarter | -24.5% | -37.5% | -24.3% | -12.5% | -9.3% | -54.5% | 2.5% | -27.3% | -10.8% | -34.1% |
| Last year | -27.1% | 150.0% | -30.9% | -30.0% | -10.0% | -60.8% | -7.8% | -54.0% | -4.0% | -52.7% |
| Last three years | -34.4% | -54.5% | -27.4% | -41.7% | -9.7% | -59.2% | 11.9% | -50.3% | -8.1% | -51.9% |
| Last five years | 67.4% | -16.7% | 11.6% | 16.7% | 22.8% | -57.4% | 30.6% | -45.9% | 35.0% | -45.9% |
| Last ten years | 174.8% | 66.7% | -2.4% | -41.7% | 33.1% | -62.3% | 54.8% | -57.0% | 53.6% | -55.9% |
Copyright notice: All figures in this article are based on data released by the Land Registry. The numbers are derived from analysis performed by PutneySW15.com. Any use of these numbers should jointly attribute the Land Registry and PutneySW15.com.
February 9, 2018