'Interesting Times' For Putney Property
Activity in mid-priced family homes falls to levels seen during financial crisis
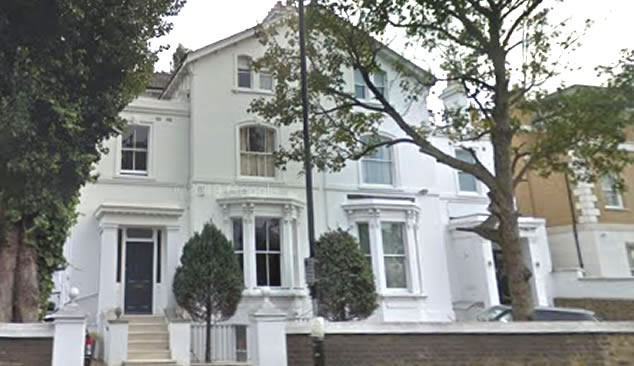
Upper Richmond Road house was highest priced sale. Picture: Google Streetview
A leading Putney estate agent has described the current state of the local property market as 'interesting times' as the latest official data shows a decidedly mixed picture.
Numbers from the Land Registry for the first quarter of 2019 indicate that the average sale price in the SW15 postcode area was £735,135 down by 7.8% from the previous three months. Over the last year prices are down by 1.6% and volumes remain at very low levels.
The most striking feature of the new data is the collapse in the number of sales of mid-priced houses. The number of terraced properties reported as being sold in the area is the lowest since the financial crisis a decade ago. Just 16 sales were registered, and although this number may increase as late reported sales are added, the levels are so low that it is thought a significant proportion may be probate sales.
Larger houses are continuing to see demand hold up relatively well. In March a five bedroom semi on the Upper Richmond sold for £2,950,000 having changed hands in July 2010 for £2,550,000. Meanwhile in February a four bedroom house on Roehampton Gate, went for £2,850,000. It has previously been sold in 2012 for £2,710,000 but this time the property was sold with planning permission for a 10,500 sq ft home.
Demand for flats seems to have stablilised but all the transactions recorded in the first three months of the year being in the secondary market
Local estate agent Allan Fuller responded to these figures, "As Confucius might have said if he was an estate agent in Putney now, 'we live in interesting times'. We did get used to property values rising inexorably, the last couple of years have proved that does not always happen. The reason this time is the increase in stamp duty as well as worries about Brexit. But in many respects property had reached somewhat of a peak and in reality property can only sell if is affordable.
"What my office is experiencing is just that, correctly priced properties attract interest and get sold. With Brexit still rumbling on and possibly for months to come, we can see that people are getting on with their lives, point is that regardless there are still the natural passages of life, job moves, growing families, marriages, divorces and relationships formed and divided. All of these reasons, and more, create the need to move home.
"This is usually one of the busiest time of the year and after a slow winter we are seeing much more activity. This will stabilise prices while we can leave the politicians to continue squabbling, which seems to be all that they are good at!"

Roehampton Gate
Another local property practitioner when asked about the lack of activity in the new build sector said, "There is a danger of a serious overhang of inventory in SW15. Banks are still keen to lend to developers urged on by the government who want to maintaining housing starts but a key prop to ensuring these new units are sold is the Help To Buy scheme. With many of the new units in the Putney area going on the market at over the threshold of £450,000 this important source of demand is not available."
Earlier this year, Guy Gittins, Managing Director of Chestertons, said that the imbalance between supply and demand has helped slow the rate that house prices in London have been falling. In Property Industry Eye he said,"Following two years of substantial price drops, the market is now bottoming out in London..... This dramatic imbalance between supply and demand is starting to fuel small price increases in areas like Hyde Park and Putney as competition ramps up – and we’re even seeing instances of buyers attempting to ‘gazump’ others by offering to pay over asking price. The signs of recovery are there, with the prime market leading the way".

The Nationwide’s House Price Index showed that London had the fastest pace of decline in the UK in the first quarter of 2019 with prices down by 3.8% compared with the same period in 2018 averaging £455,594. This is the steepest fall for the area since 2009 and the seventh consecutive quarter in which prices have declined. The Nationwide’s analysts say this partly reflects the level of price out performance previously seen in the capital and the impact of policy changes on the Buy to Let market which has had a bigger effect on London because the private rental sector accounts for a larger proportion of the housing stock than elsewhere in the country.
Commenting on the figures, Robert Gardner, Nationwide's Chief Economist, said, “UK house price growth remained subdued in March, with prices just 0.7% higher than the same month last year.
“Indicators of housing market activity, such as the number of property transactions and the number of mortgages approved for house purchase, have remained broadly stable in recent months, even though survey data suggests that sentiment has softened.
“Measures of consumer confidence weakened around the turn of the year and surveyors report that new buyer enquiries have continued to decline, falling to their lowest level since 2008 in February.”
The March 2019 RICS UK Residential Survey results show little departure from the subdued picture evident across the sales market for several months now. They say forward looking indicators suggest this lack of momentum is likely to continue for a while longer, although perceptions on the twelve month outlook are a little more sanguine. However London and the South East continue to display the weakest sentiment in terms of prices.
| Putney Property Prices (January - March 2019) | ||||||||||
|---|---|---|---|---|---|---|---|---|---|---|
Area |
Detached |
Sales |
Semi-detached |
Sales |
Terrace |
Sales |
Flat/ mais |
Sales |
Overall Ave |
Overall Sales |
| SW15 1 | 0 | 0 | 1351750 | 4 | 1285357 | 7 | 547054 | 14 | 882530 | 25 |
| SW15 2 | 0 | 0 | 830000 | 1 | 1068833 | 3 | 496544 | 17 | 594179 | 21 |
| SW15 3 | 0 | 0 | 815000 | 2 | 545000 | 1 | 482437 | 16 | 520737 | 19 |
| SW15 4 | 0 | 0 | 0 | 0 | 500000 | 1 | 296667 | 3 | 347500 | 4 |
| SW15 5 | 2850000 | 1 | 1058333 | 3 | 782500 | 4 | 471557 | 7 | 830393 | 15 |
| SW15 6 | 2943750 | 2 | 2950000 | 1 | 0 | 0 | 537531 | 16 | 917789 | 19 |
| Total | 2912500 | 3 | 1272000 | 11 | 1023687 | 16 | 501512 | 73 | 735135 | 103 |
| Last quarter | 25.6% | -57.1% | -14.6% | 10.0% | 8.7% | -59.0% | 1.9% | -3.9% | -7.8% | -22.0% |
| Last year | 13.7% | -40.0% | -10.2% | -8.3% | -3.1% | -55.6% | 7.2% | -27.7% | -1.6% | -33.1% |
| Last three years | 60.1% | -62.5% | -3.9% | -59.3% | 2.6% | -74.6% | -16.9% | -73.2% | -1.9% | -72.2% |
| Last five years | 89.0% | -57.1% | -12.2% | -35.3% | 29.2% | -66.0% | 16.8% | -65.4% | 27.0% | -63.5% |
| Last ten years | 65.3% | 6.7% | 59.0% | 28.1% | 69.3% | 30.4% | ||||
Copyright notice: All figures in this article are based on data released by the Land Registry. The numbers are derived from analysis performed by PutneySW15.com. Any use of these numbers should jointly attribute the Land Registry and PutneySW15.com.
May 10, 2019